


'); background-image: linear-gradient(180deg, rgba(25, 67, 136, 0.7), rgba(25, 67, 136, 0.7)), url(' ');"
>
');"
>
');"
>
');"
>
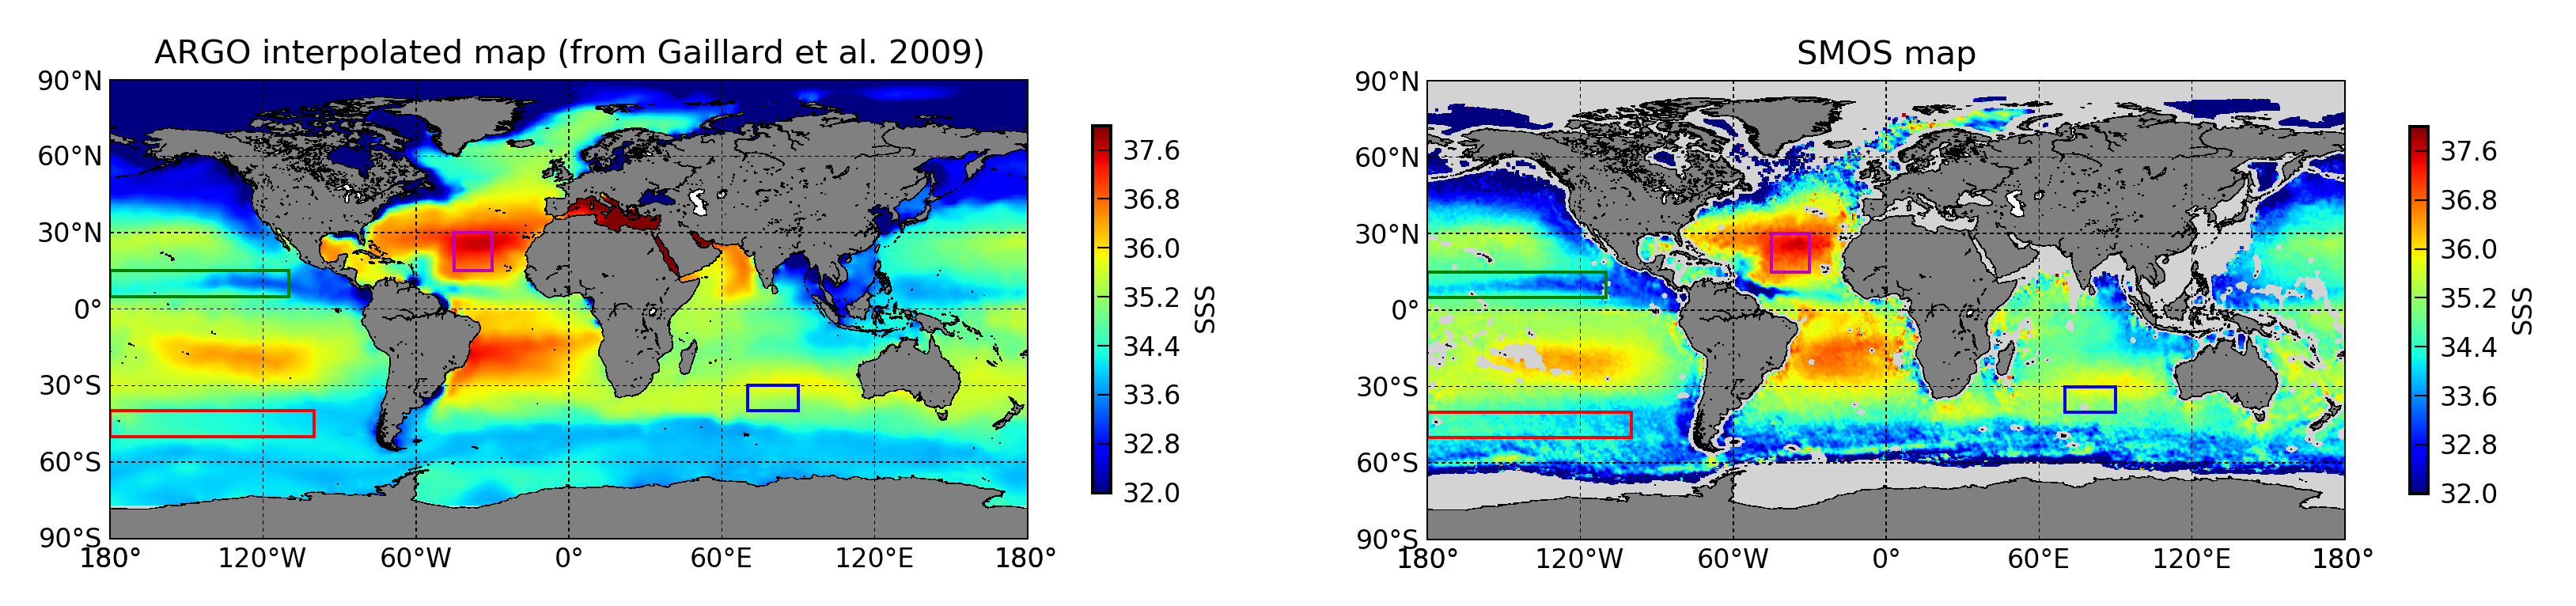
A map of surface salinity levels (between 32 and 38‰) recorded between August & September of 2010 and 2011 by the European Space Agency’s Soil Moisture and Ocean Salinity (SMOS) satellite, the first such satellite in the world
ESA


Five years of global sea-surface salinity from SMOS
ESA/Ifremer–N. Reul